Viewing reports
Our system provides you with the ability to access a wide range of reports that encompass various aspects of your participants' data and financial information.
To access the reports, you have two options:
-
Navigate to the View Registrantssection and then click on the "Reporting" tab.

-
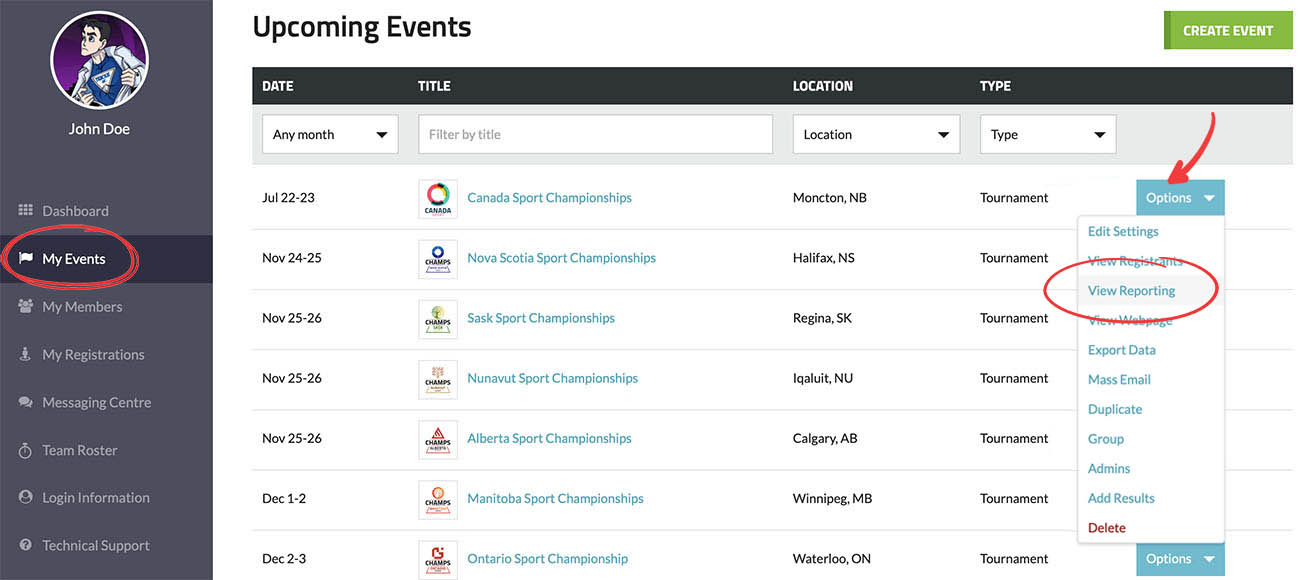
Go to either the My Events or My Members section, and then click on the "Options" button, and the "View Reporting" option.
For further details regarding the various reports available, please refer to the sections below.
To view the "Participants" reports, simply click on the "Participants" button. Below is an example of what the participant reports look like. Below the photo, we provide a detailed overview of the reports.
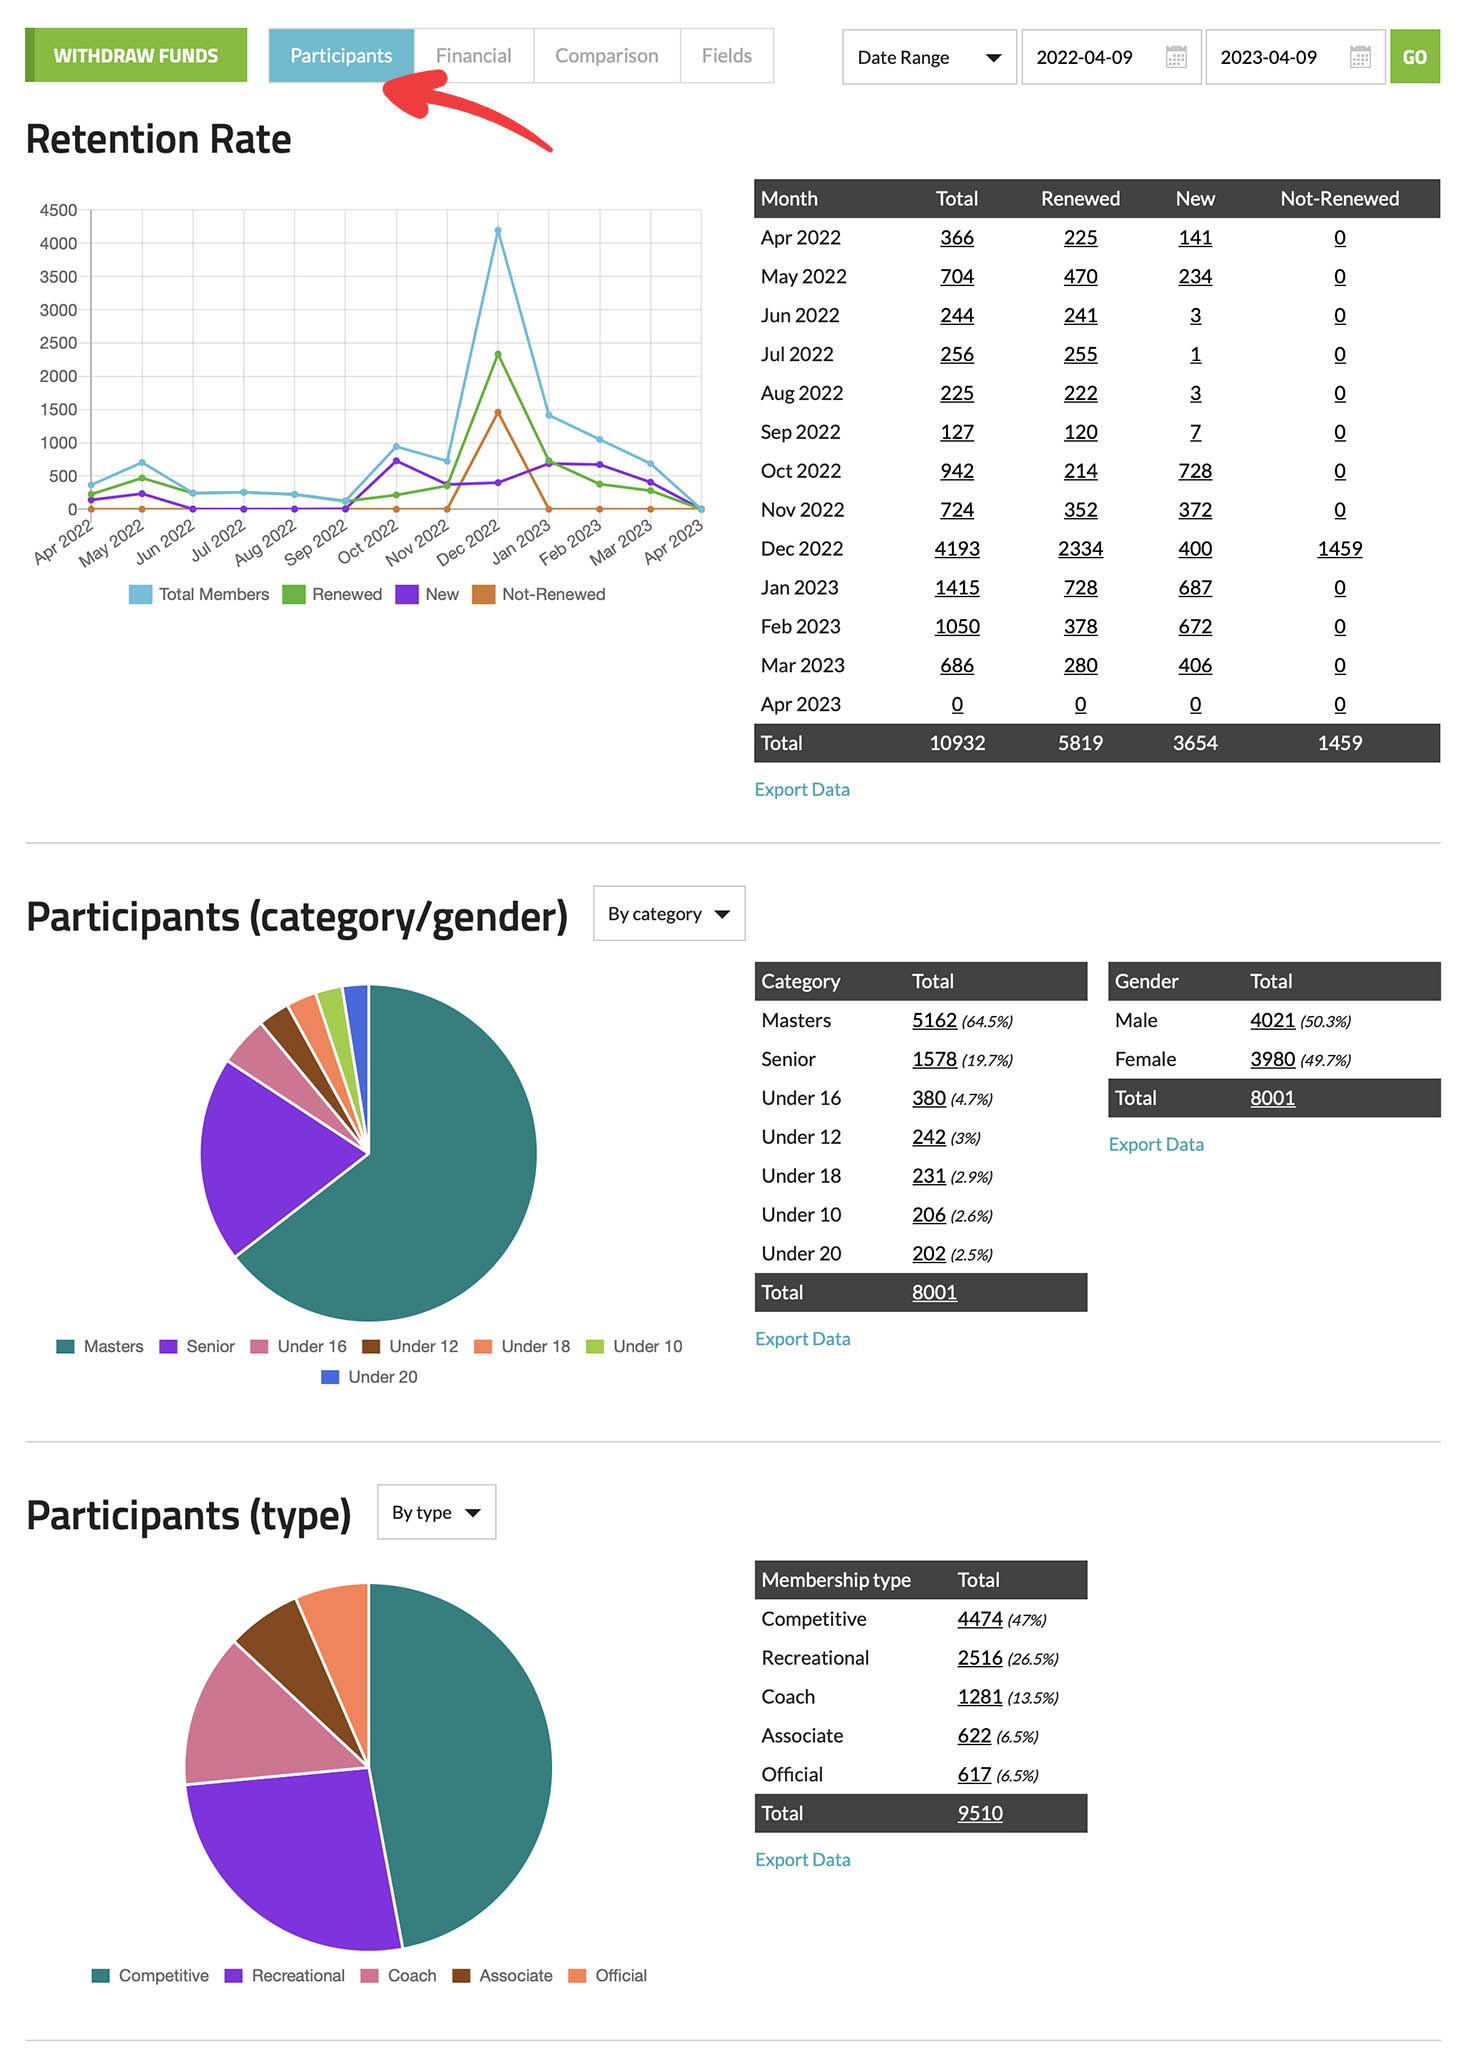
Retention Rate: This report is available for seasonal membership types only. It allows you to conveniently track new members, renewing members, and those who have not yet renewed.
Participants (category/gender): This report provides information based on the categories and gender of your participants.
Participants (type): This report provides information based on the divisions (or membership types) of your participants.
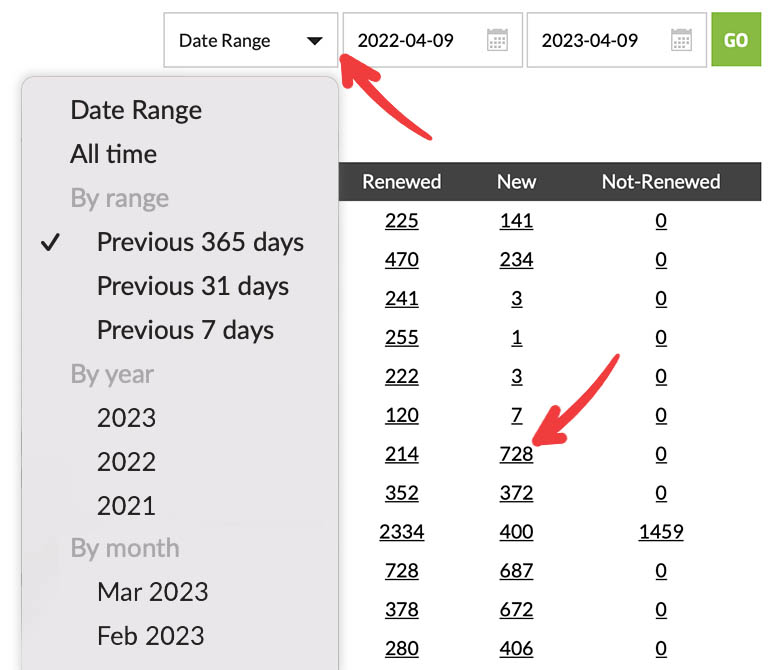
Note that you can click on any underlined data points within the data tables, and you can also set the date range for your report in the top-right corner.
To view the "Financial" reports, simply click on the "Financial" button. Below is an example of what the Financial reports look like. Below the photo, we provide a detailed overview of the reports.
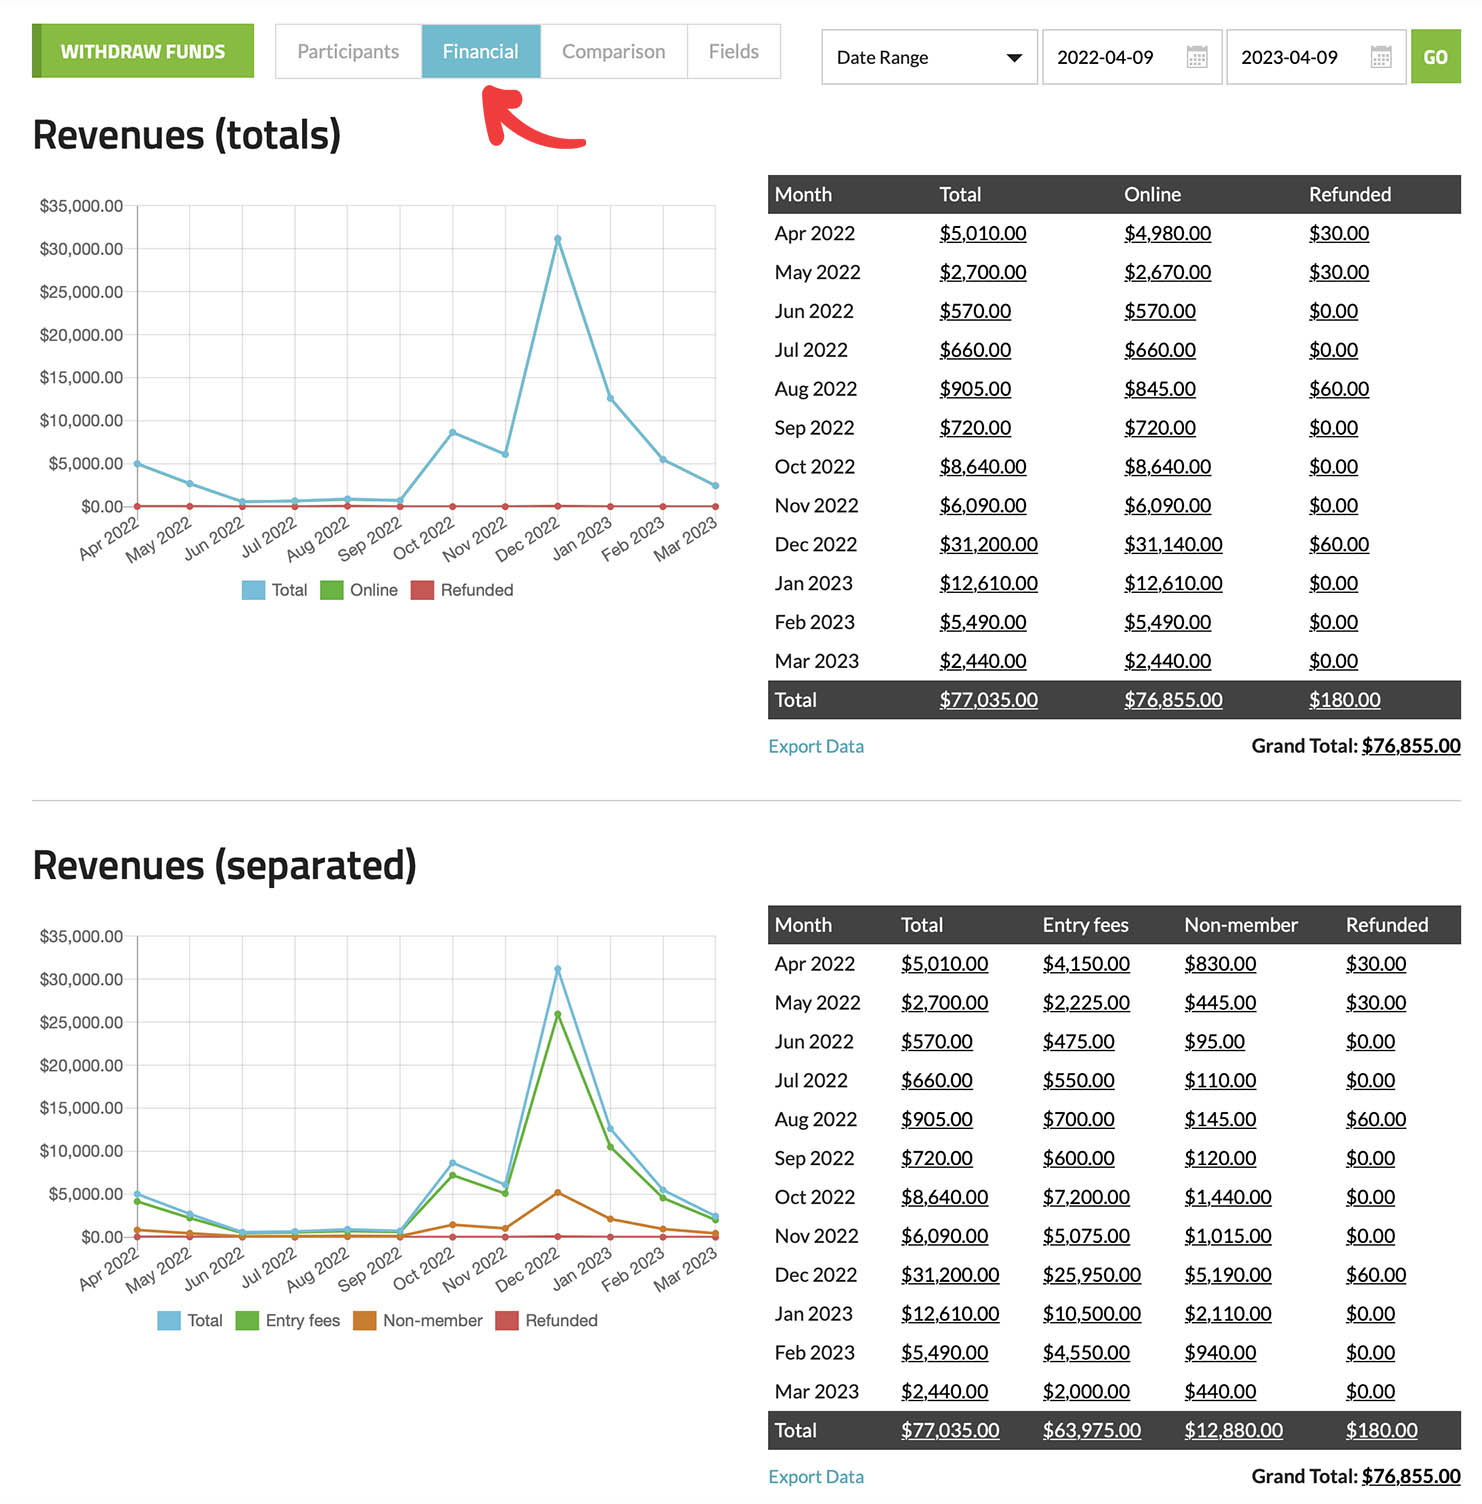
Revenues (totals): This report displays the total revenues collected during the specified time period.
Revenues (separated): This report offers a comprehensive breakdown of your revenues, categorized by the pricing you have set up, such as entry fees, non-member fees, extra fees, and additional purchases.
To view the "Comparison" reports, simply click on the "Comparison" button. Below is an example of what the Comparison reports look like. Below the photo, we provide a detailed overview of the reports.
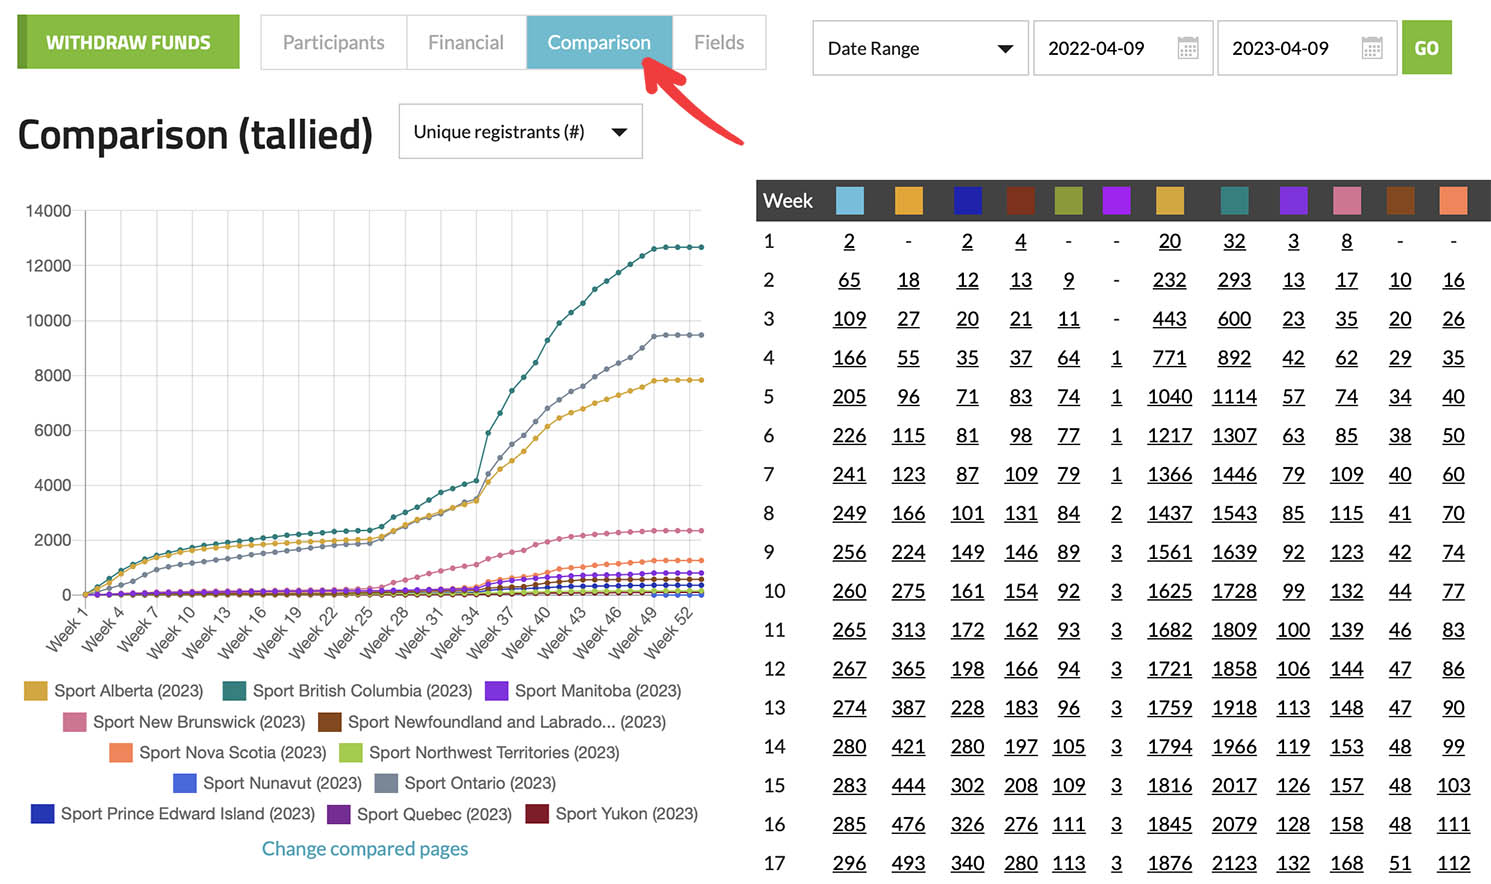
Comparison (tallied): This report enables you to compare registration data across different clubs or events that you have access to. It can be valuable for comparing events over multiple years, providing insights into your growth or decline trends.
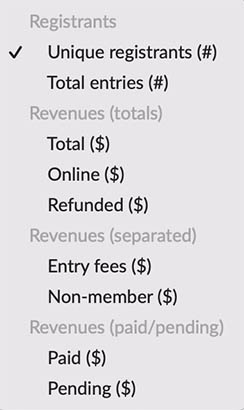
Through the drop down menu next to "Comparison (tallied)", you have many options to select from depending on your registration setup.
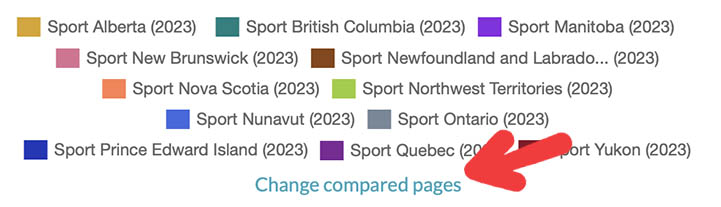
You have the flexibility to modify the pages being compared by clicking on the "Change compared pages" link.
To view the "Fields" reports, simply click on the "Fields" button. Below is an example of what the Fields reports look like. Below the photo, we provide a detailed overview of the reports.
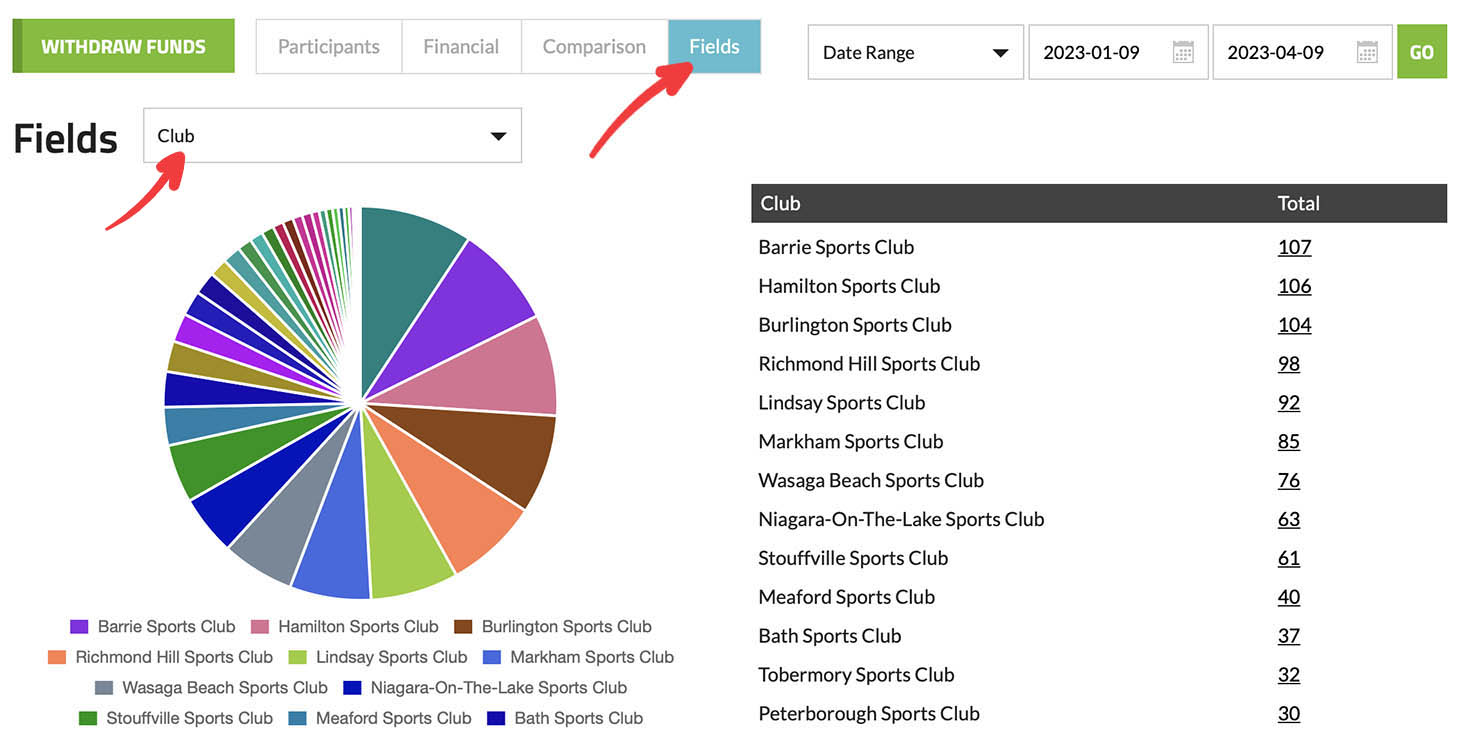
Fields: This report allows you to generate a report on any of your registration fields, which includes questions you have set up such as Club, Member #, and others. To modify the "Field," simply click on the drop-down menu located to the right of the "Fields" title.